Hi everybody,
I'm new to Inkscape and would like to create something like this using Inkscape:
Requirements:
- concentric doughnuts
- each doughnut automatically divided in x equal segments (different number of segments for each doughnut)
- text aligned to the curve of each segment
Do you think it's possible?
In advance, thank you for your answers and support.
Best regards,
How to create a flow chart out of concentric doughnuts
Re: How to create a flow chart out of concentric doughnuts
everything in your graphic is possible - even easy - as long as you don't use the a-word. "Automatically". I'm not sure how to interpret this in terms of how much work makes something not "automatic". Inkscape can certainly make concentric circles, fill them with gradients of different colours, divide them into sector shaped objects, insert text aligned to a path, etc. But user control is necessary; you have to learn to use at least some of Inkscape's tools, know how to put objects on top of others,etc.
I don't mean to sound like it's particularly difficult . If people spent as much time working through inkscape as they do working through the levels of just one shoot-em-up video game they would be quite expert, IMHO.
So my qualified answer is yes, and sorry if I drifted into rant mode!
I don't mean to sound like it's particularly difficult . If people spent as much time working through inkscape as they do working through the levels of just one shoot-em-up video game they would be quite expert, IMHO.
So my qualified answer is yes, and sorry if I drifted into rant mode!
Your mind is what you think it is.
Re: How to create a flow chart out of concentric doughnuts
Hi Koshka,
Welcome to InkscapeForum!
Yes, I agree. Absolutely possible! Although like druban said, breaking the donut into sections "automatically", like with a couple of clicks, is not possible. There are probably a few different ways to approach the problem, so I won't launch into instructions at this time. But definitely let us know what you're doing and where you're stuck, and we'll be glad to offer suggestions!
Basics - Help menu > Tutorials
Manual - Inkscape: Guide to a Vector Drawing Program
Inkscape Community - Inkscape FAQ - Gallery
Inkscape for Cutting Design
Manual - Inkscape: Guide to a Vector Drawing Program
Inkscape Community - Inkscape FAQ - Gallery
Inkscape for Cutting Design
Re: How to create a flow chart out of concentric doughnuts
While these are goofy and information poor, and business people should never be allowed to use the word "cloud," I don't think doughnuts are the easy answer. (Unless of course, you use doughnuts to bribe the chart maker into developing an infographic instead.)
That would be why you don't allow business people around charts. Automagical over simplifications shouldn't be made pretty with gradients.
It could be done with circles of varying sizes, one atop the other. Of course you can grab the segment handle of the circle tool and create pie slices. Interesting that description does not disclose degrees of the segment. Control+Drag constrains the arc, but again the degree of arc isn't readily shown. I suppose it is one of those quaint unix-command-line deals for precision control.
But to keep it easy, you'd do a full circle on the bottom. Then a 5/6ths arc of the next color atop that. Then 4/6ths and so on -- one atop the other -- counter intuitive, but much easier than aligning six pie shapes of the exact size. They'll look like doughnuts when a small "pie" is placed over a larger one. Lots of overlap, but who cares? The point is making the task easy. And it will be anything but trying to align shapes that don't overlap.
Where's the chart explaining you shouldn't use doughnut charts?
as long as you don't use the a-word. "Automatically".
That would be why you don't allow business people around charts. Automagical over simplifications shouldn't be made pretty with gradients.
It could be done with circles of varying sizes, one atop the other. Of course you can grab the segment handle of the circle tool and create pie slices. Interesting that description does not disclose degrees of the segment. Control+Drag constrains the arc, but again the degree of arc isn't readily shown. I suppose it is one of those quaint unix-command-line deals for precision control.
But to keep it easy, you'd do a full circle on the bottom. Then a 5/6ths arc of the next color atop that. Then 4/6ths and so on -- one atop the other -- counter intuitive, but much easier than aligning six pie shapes of the exact size. They'll look like doughnuts when a small "pie" is placed over a larger one. Lots of overlap, but who cares? The point is making the task easy. And it will be anything but trying to align shapes that don't overlap.
Where's the chart explaining you shouldn't use doughnut charts?
Last edited by DC1 on Tue Feb 15, 2011 12:37 am, edited 1 time in total.
Re: How to create a flow chart out of concentric doughnuts
DC1 wrote:Control+Drag constrains the arc, but again the degree of arc isn't readily shown.
The constraint is - as described in the manual - to the Rotation snap angle as configured in the preferences (defaults to 15°). No geeky unix stuff involved.
Re: How to create a flow chart out of concentric doughnuts
(defaults to 15°)
You are talking about the tool. I am talking about an addition to Start, End on the toolbar ...which updates as you drag, not after release. Subtracting one from the other to get the object arc: Geeky. Drawing Start: 270 End 330, Start 330 End 30, Start 30 End 90, Start 90 End 120, Start 120 End 180, Start 180 End 210, Start 210 End 270 at each precise endpoint coordinate where the last segment edge ends so they all line up ...well that ain't 'xactly UNgeeky.
A person adrift in a balloon shouts down to a geek on the ground, "where am I?"
The Geeky answer: "Thirty feet above the ground, heading Northeast at five miles per hour." Technically correct. Accurate to be sure. Just less than helpful.
Re: How to create a flow chart out of concentric doughnuts
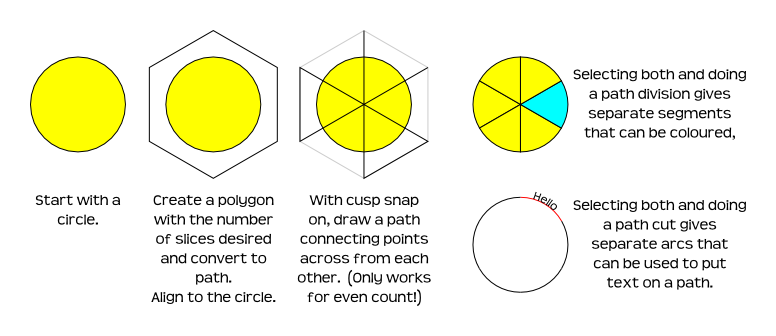
Here would be my starting point for making such a chart:
YMMV.
-Rob A>
YMMV.
-Rob A>